Analytics and experiments
Engage analytics joins product events with messaging and workflow lifecycle data while preserving the distinction between provider acceptance, device delivery, display, and interaction.
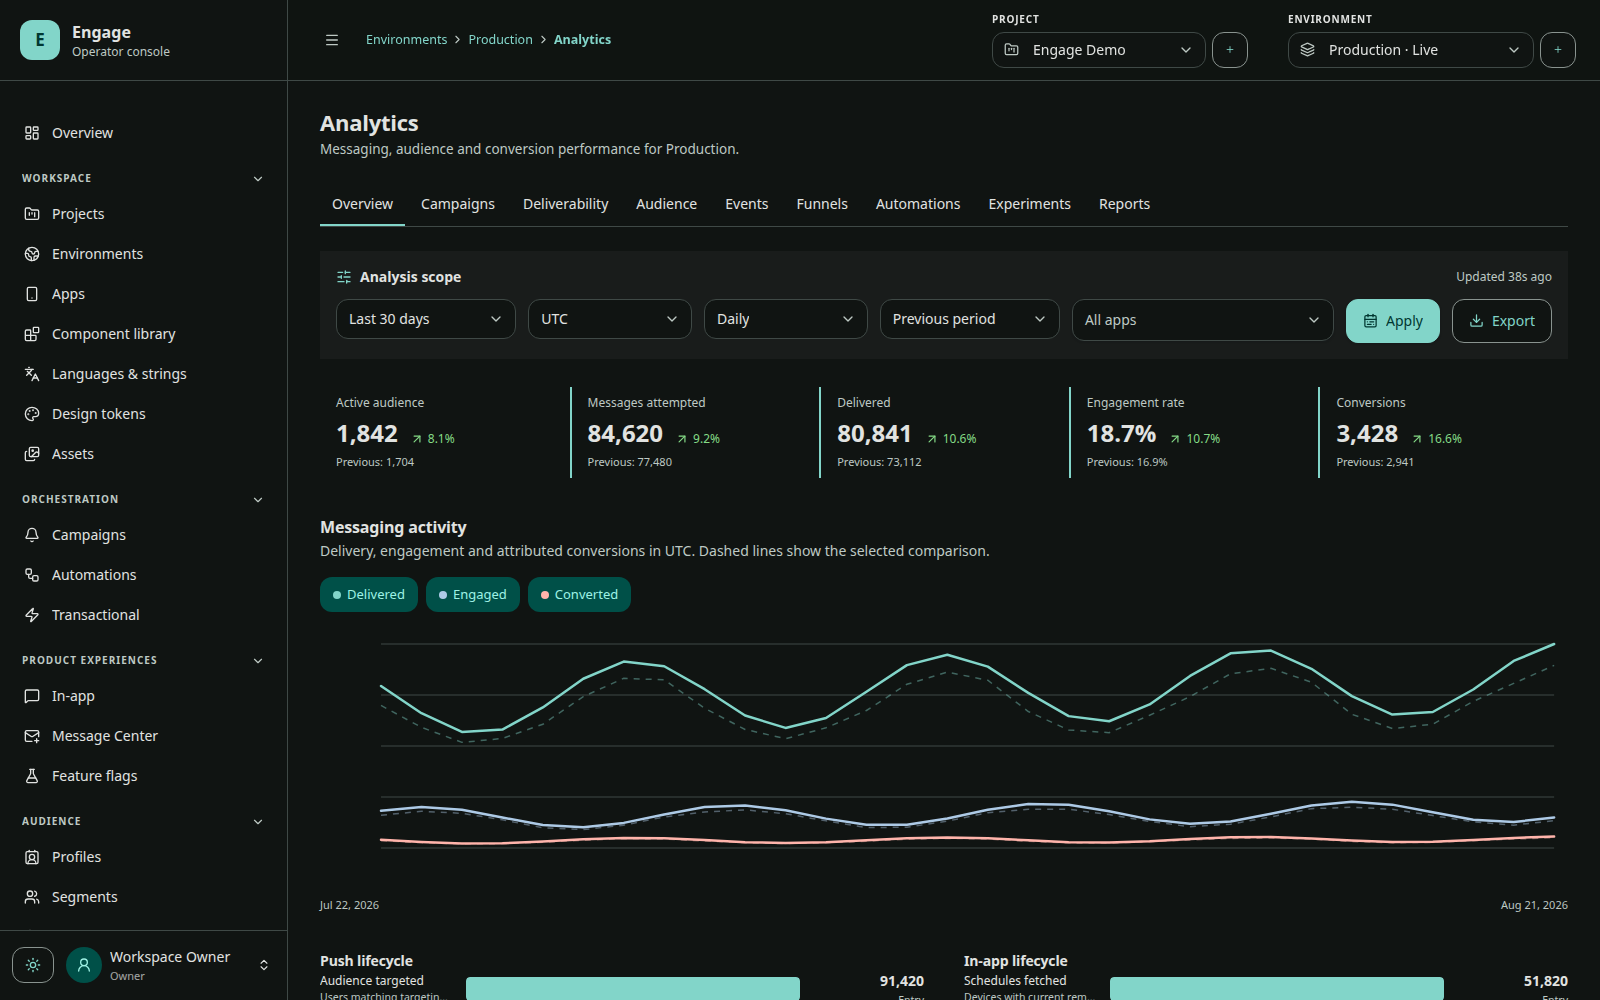
Messaging funnel
Each step has a different denominator. A 25% delivery rate can be correct even when every provider request was accepted if only one of four devices produced a delivered receipt.
Available analysis
- event volume and profile activity;
- push targeted, accepted, delivered, failed, opened, and provider diagnostics;
- in-app eligible, impressions, unique impressions, clicks, dismissals, and conversions;
- Message Center inbox/read/action activity;
- segment size, membership changes, performance, and overlap;
- funnel steps and conversion;
- automation entries, active/completed/converted profiles, failures, and per-node performance;
- feature flag and experiment variant performance;
- usage, quotas, provider health, exports, scheduled reports, and retention.
Experiments
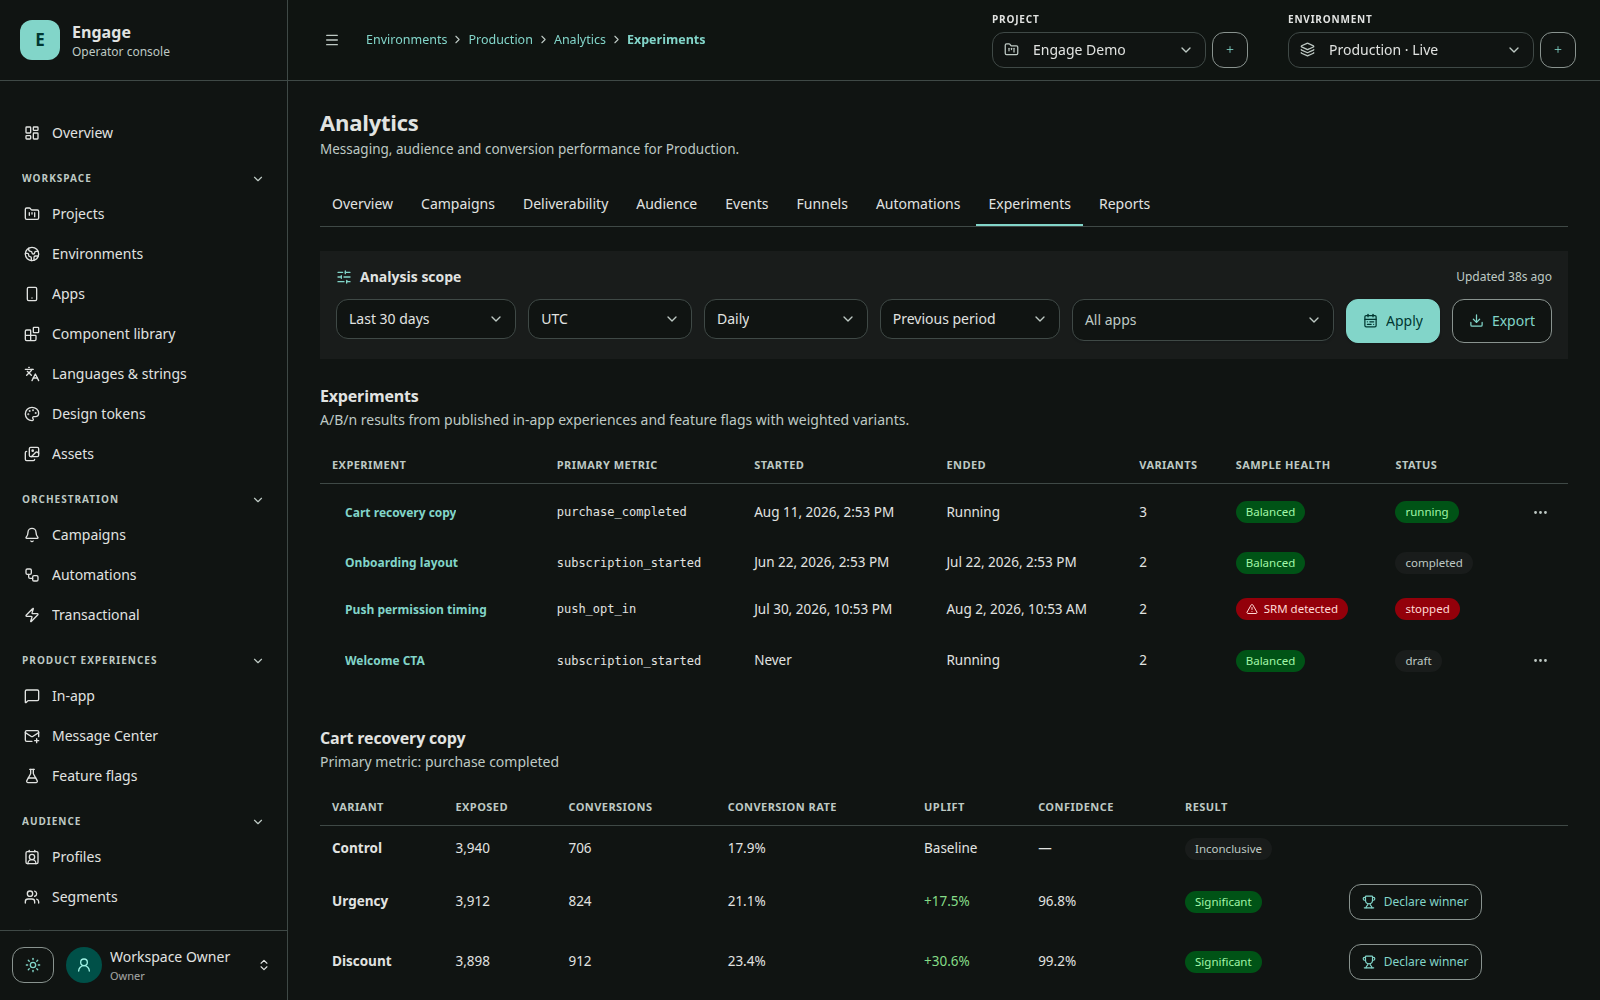
Feature flags and in-app variants use deterministic allocation. A published revision fixes the tested configuration. Define a conversion event before activation and avoid changing event semantics during a running experiment.
Interpret experiment results only after checking sample size, exposure, audience drift, app version distribution, delivery eligibility, and attribution window.
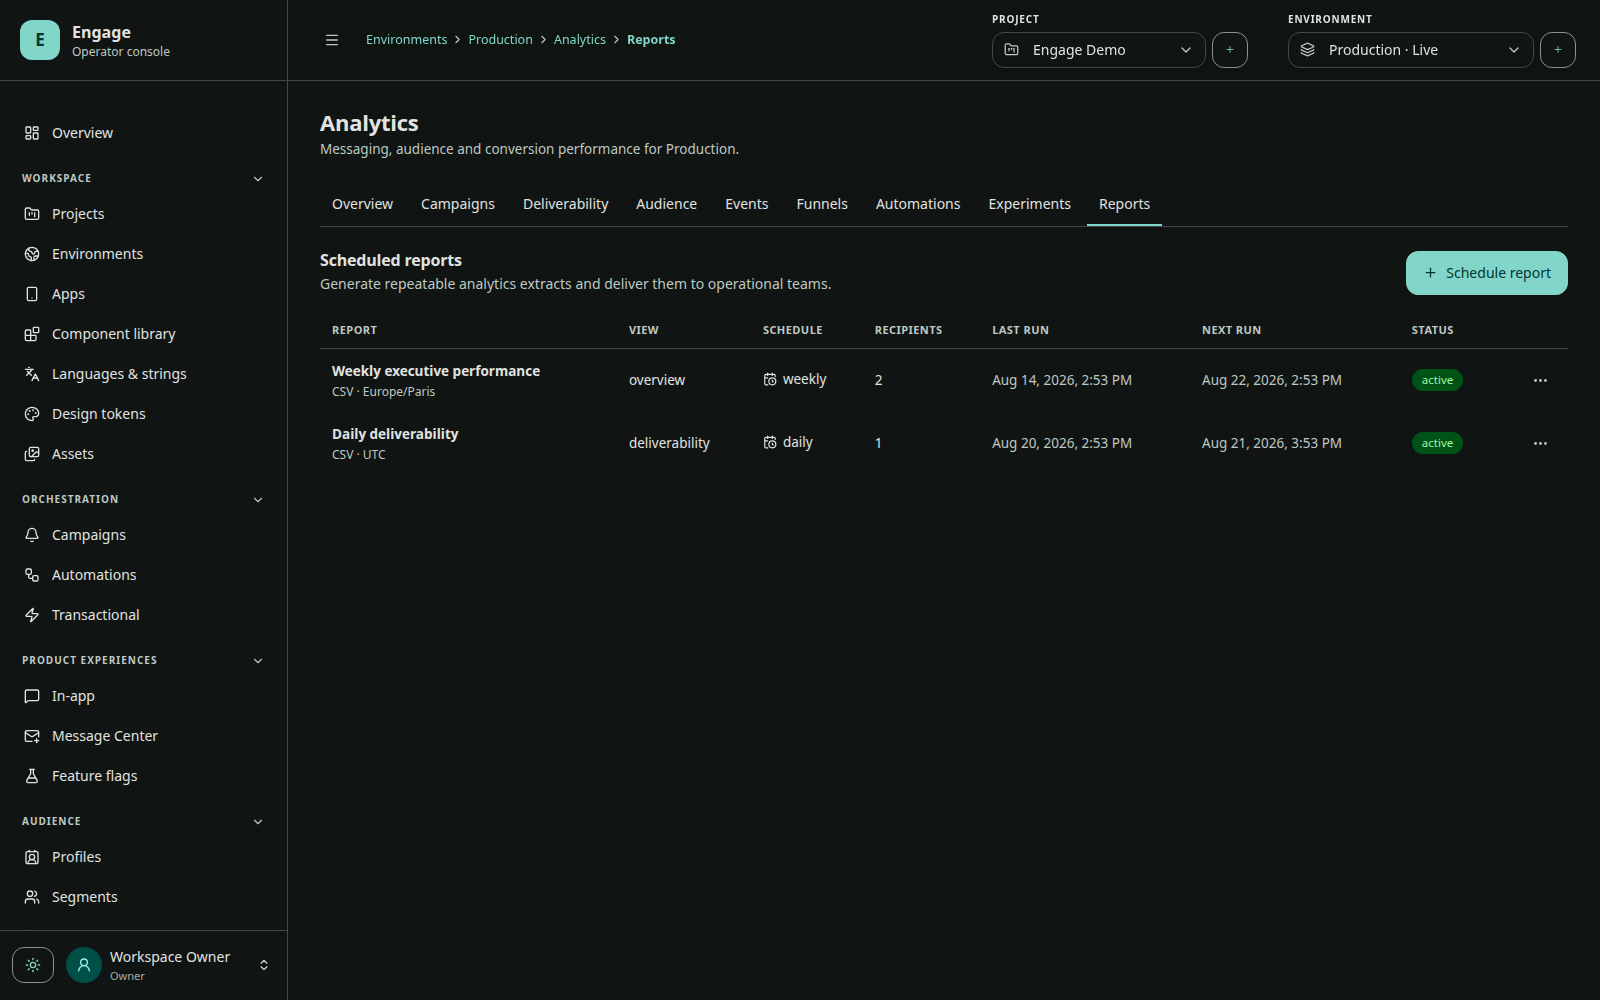
Exports and reports
Exports and scheduled reports run as backend jobs rather than tying up an interactive request. Apply workspace permissions and privacy policy to exported profile/event data. Treat download artifacts as sensitive and expire them according to retention policy.
Operational analytics
Provider error codes, outbox attempts, token invalidation, webhook attempts, automation step failures, quota pressure, and data freshness are operational signals. Use Diagnostics to investigate a metric rather than inferring provider failure from one aggregate rate.